In a previous post, I shared information on comic book sales trends in the 1940s. While John Jackson Miller’s excellent ComiChron is a reliable site for contemporary (and some historic) sales data, there’s a gap in what’s easily available.
This morning I perused Judith S. Duke’s 1979 book Children’s Books and Magazines: A Market Study, which provides some broad insights into comics sales in the mid-1970s. Her data was sourced from both the Comics Magazine Association of America (CMAA) and Standard Rate and Data Services’ (SRDS) Consumer Magazines for March 28, 1978. Although it’s not fine-grained data, the reported circulation figures offer a glimpse of market conditions for 1977.
| PUBLISHER | # OF TITLES | MONTHLY SALES | AVG SALES / TITLE |
| Archie | 30 | 4,507,565 | 150,252 |
| Charlton | 17 | 2,438,533 | 143,443 |
| DC | 18 | 8,014,821 | 445,268 |
| Gold Key | 38 | 3,969,574 | 104,462 |
| Harvey | 28 | 3,297,135 | 117,755 |
| Marvel | 16 | 14,634,089 | 914,631 |

In the table above, the average sales per title figures do not take into account the publishing frequency of any particular title: they are simply raw averages based on monthly sales divided by number of titles. For a couple of contemporary comparisons: in 2019, comic shops have ordered about 573,000 copies of the 1000th issue of Detective Comics and only 11 single issues have surpassed 100,000 in comic shop orders.
An update: on Twitter, John Jackson Miller writes, “The Marvel title average is SURELY incorrect — and the DC average also looks suspect. No Marvel title had monthly sales above the 300,000s in this era; Star Wars #1-3 did a million each, but that’s it.…Duke appears to have mistaken the ABC’s two-month totals for Marvel and DC as a single month. DC’s monthly circ in 1977 was around 4 million; Marvel 7 million. That’s error #1…Then Duke was obviously far wrong on the number of monthly titles from some of the publishers, Marvel and DC included. Those numbers should be much higher — and the per-title averages much lower.” It’s unclear from how Duke reported her data which parts came from CMAA and which from SRDS. John’s tweet mentions ABC (Audit Bureau of Circulation), which is not the same as SRDS but deals with similar figures. Having spent time looking at other circulation reports to ABC and similar directories, I can attest that it’s easy to misinterpret data because of how it is reported and aggregated.

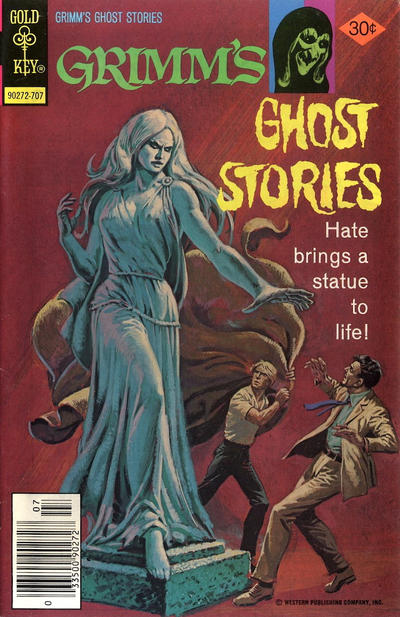
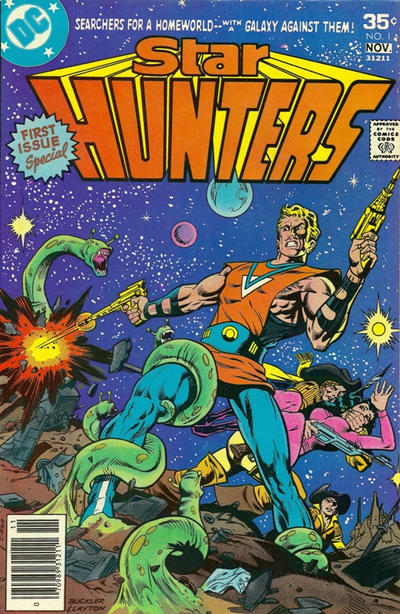
What were the comics that sold better in 1977 than almost anything published today (at least in terms of volume)? Well, Gold Key had books like Bugs Bunny and Tales of Sword and Sorcery DAGAR THE INVINCIBLE, while Harvey’s series included Richie Rich & Casper. Titles from the other publishers included Archie’s Everything’s Archie, Marvel’s 2001: A Space Odyssey, DC’s Star Hunters, and Charlton’s Scary Tales.
The CMAA estimated that total sales for the year totaled about 200 million comics, generating about $60 million in revenue. In today’s dollars, that comes to about $259 million, or about $100 million less than print floppy comics sold in the US last year. They reported a pass-on readership rate—that is, the number of readers who touched a single copy—of 3.5.
Duke reported the rates for 4-color full page ads for each of the publishers, and it’s interesting to note that while Marvel topped sales, its ad rate ($16,365) was $80 lower than DC’s rate ($16,445). Charlton was the bargain (of sorts) at $2,300, followed by Gold Key at $4,950, then Harvey at $6,600, and finally Archie at $8,400.
Cheers…and watch this space for more comics history geekery soon!
I’m afraid this data is suspect, at least in terms of the title counts involved. No Marvel title got anywhere near a million copies in the entire decade (except for Star Wars #1-3, thanks to Whitman). Let me look at my own postal and ABC data on the year and I can guess at what they might have been looking at.
Okay, I see what’s going on. Duke appears to have mistaken the ABC’s two-month totals for Marvel and DC as a single month. DC’s monthly circ in 1977 was around 4 million; Marvel 7 million — half what we see above.
Then Duke was obviously far too low on the number of monthly titles from Marvel and DC. Those numbers should be much higher — and the per-title averages much lower.
I think her data probably originally did start with the Audit Bureau — just it wasn’t interpreted correctly. The two-month accounting period, which lasted for a good while, isn’t something most people would have known about.